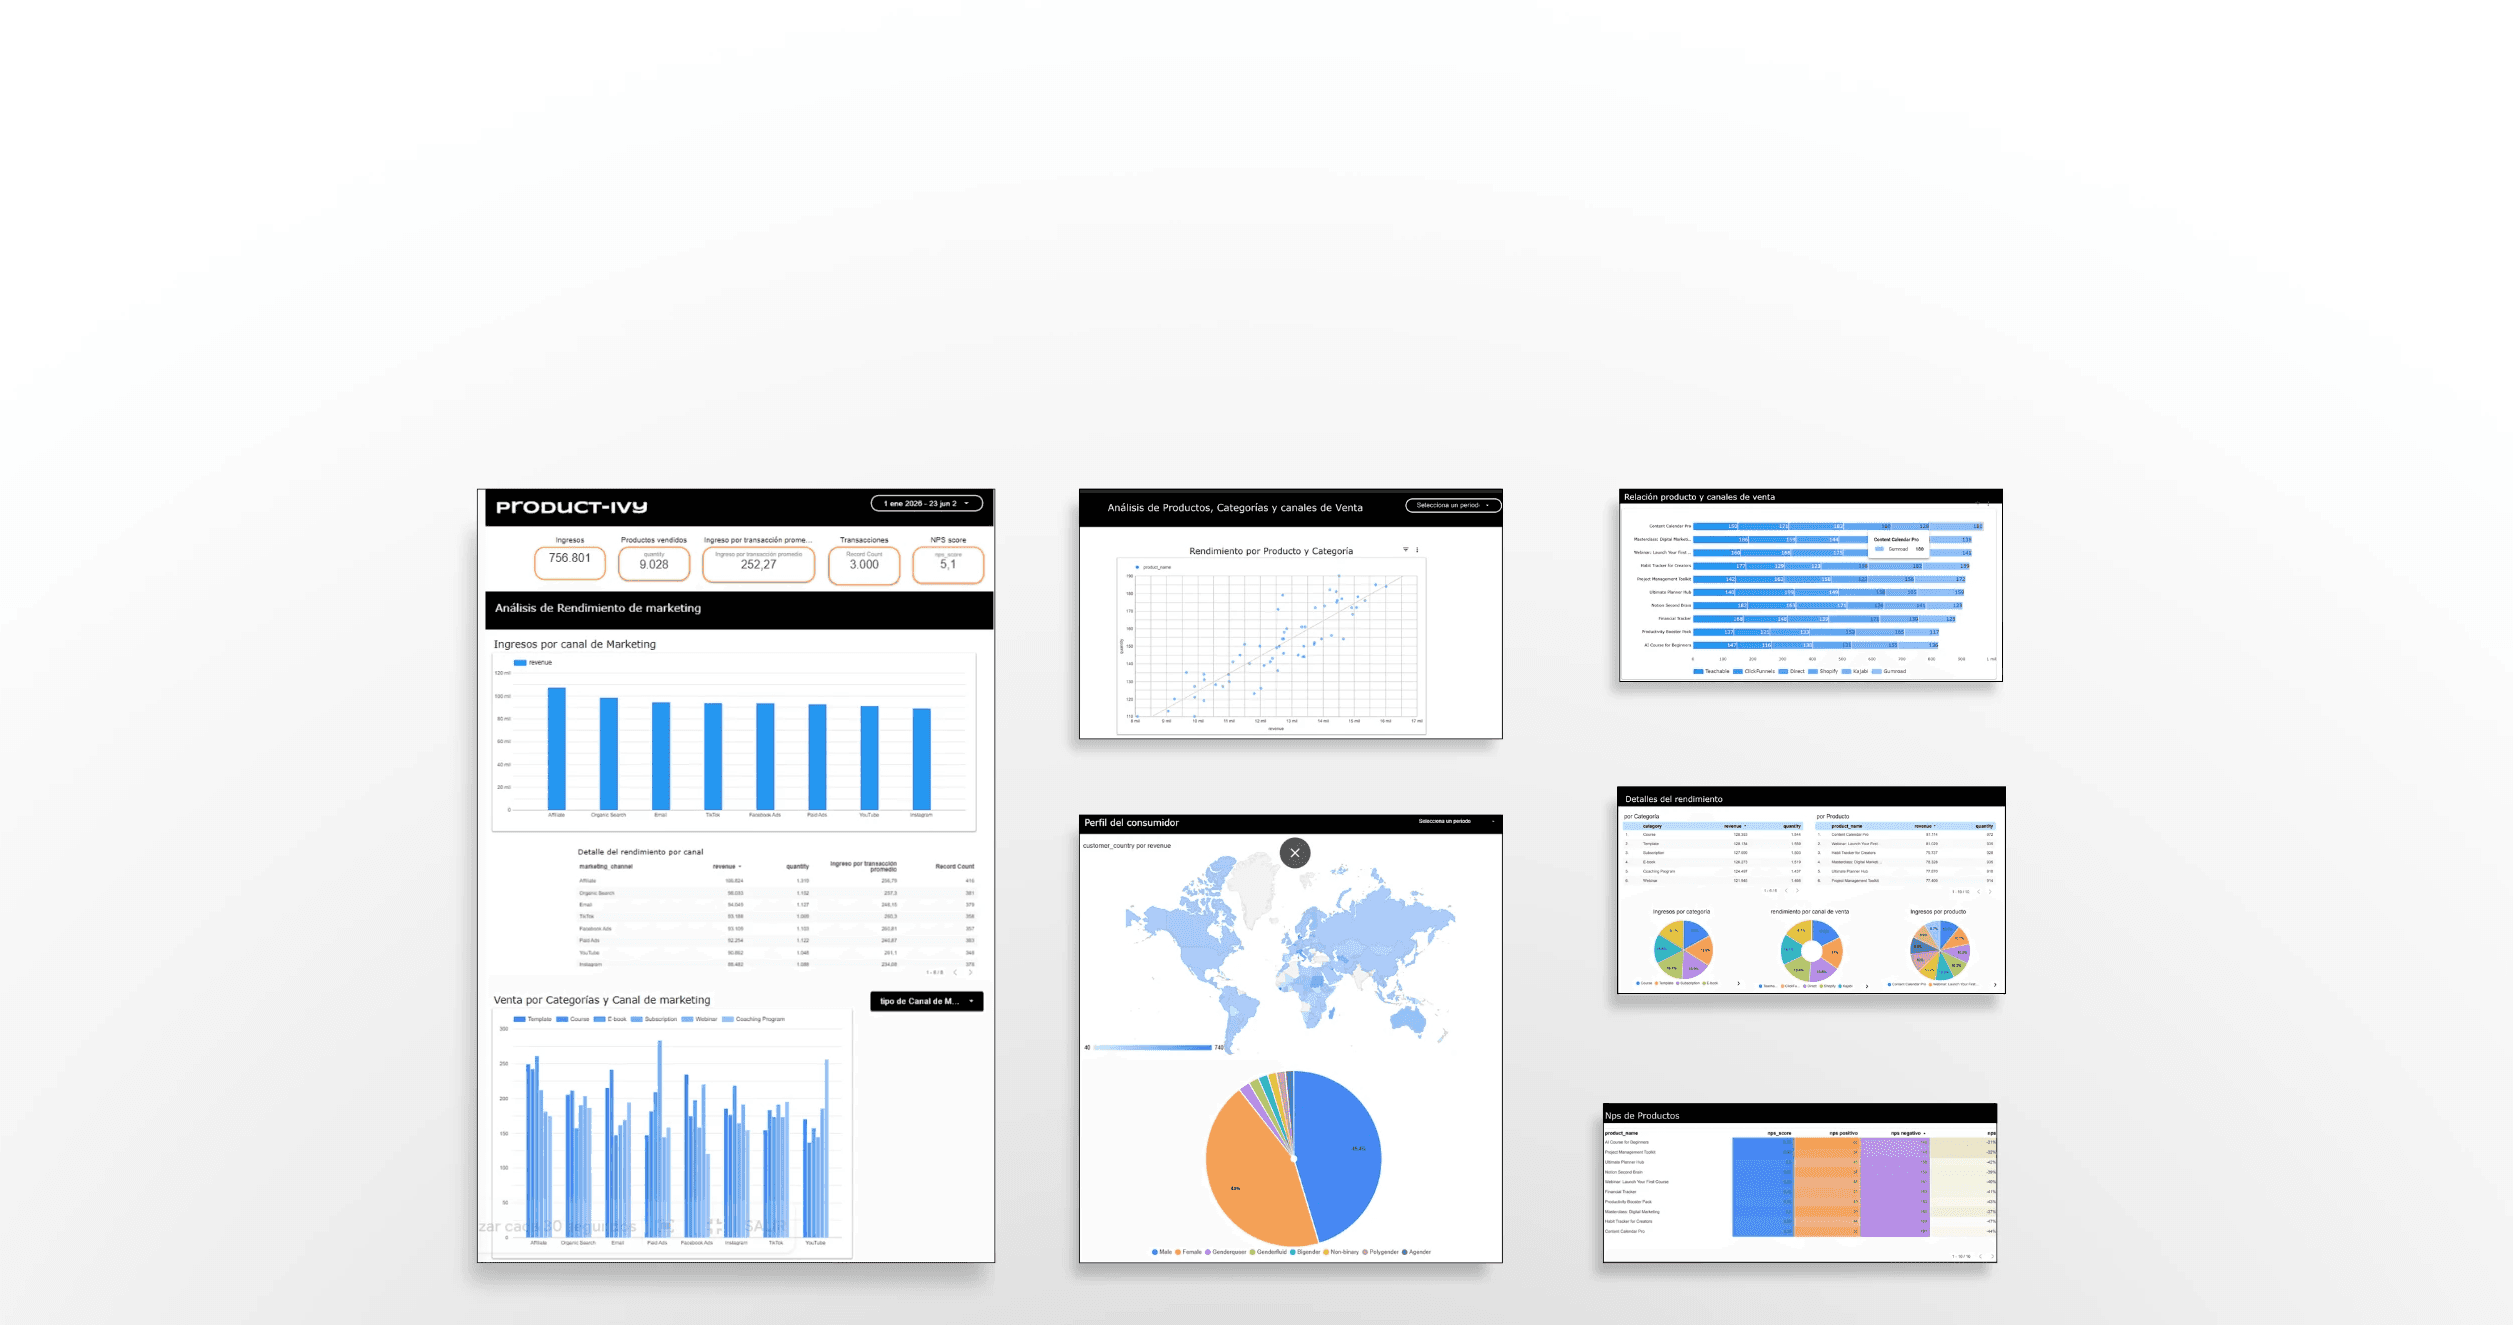

With 8 acquisition channels running simultaneously and 3,000 transactions in the period, the brand had data but no clarity. Every channel showed revenue — but revenue alone doesn't tell you where to invest next, where to cut, or why some customers spend more than others. The real problem wasn't lack of data. It was lack of interpretation.
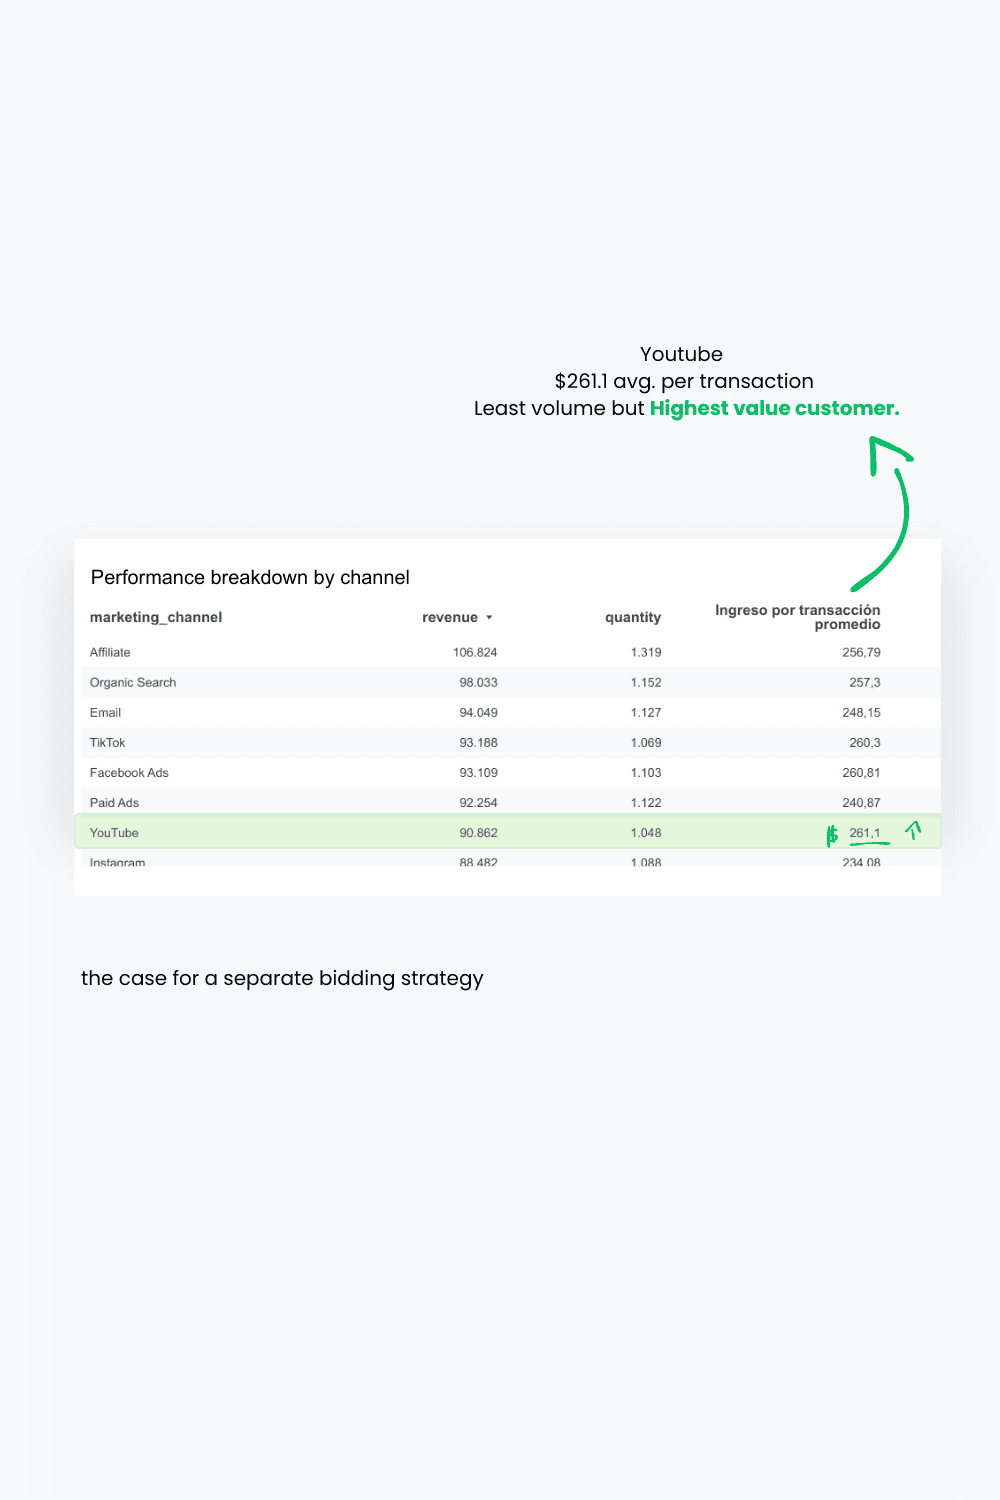
Affiliate led in total revenue at $106K — but YouTube, ranking 7th, had the highest average transaction value at $261 per purchase. That gap means two completely different buyer profiles and two completely different optimization strategies. Treating all channels equally would have meant over-investing in volume and under-investing in the channel attracting the most valuable customers.

Every single product in the catalog showed a negative NPS score, ranging from -32% to -47%. That's not a product problem or a channel problem — it's a systemic post-purchase experience failure. No acquisition strategy fixes a retention leak at that scale. The recommendation was clear: before increasing ad spend, the brand needed to address what happens after the sale.
Cross-referencing product categories against sales channels revealed that certain product types consistently outperformed in specific channels — patterns invisible when looking at either dimension alone. Courses and Templates led in revenue but showed the highest NPS gap, suggesting strong acquisition with weak delivery experience.


The analysis reframed where the brand's next investment should go: not more acquisition spend, but post-purchase experience repair first. YouTube warranted a separate bidding and creative strategy from volume-focused channels. And category-channel matching offered an immediate optimization opportunity without increasing budget. Three actionable recommendations, all grounded in data that was already there — just unread.


THIS WEBSITE IS ON BUILD - MAY HAVE ISSUES
All rights reserved to OhryCreativeClub 2026